


XRP price has slipped below its 50-day moving average near $1.43, leaving its rebound toward $1.39 facing resistance as Evernorth prepares for its delayed Nasdaq debut.

Share
XRP price has slipped below its 50-day moving average near $1.43, leaving its rebound toward $1.39 facing resistance as Evernorth prepares for its delayed Nasdaq debut.
Summary
- XRP price traded near $1.39 after falling 7.6% over seven days, according to CoinGecko.
- The daily chart places the 50-day moving average at $1.4336 and the 200-day at $1.2805.
- CoinGlass shows overhead liquidation concentrations around $1.43–$1.44 and $1.53–$1.54.
- Evernorth expects XRPN trading to begin Oct. 12, subject to closing conditions and Nasdaq requirements.
CoinGecko recorded XRP at about $1.39 on Oct. 9, with a seven-day trading range of $1.32–$1.53. The token remained down 7.6% over that period despite a 4.5% recovery over 24 hours, while its market capitalization stood near $87.6 billion.
The Binance XRP/USDT weekly chart on TradingView showed a separate calendar-week decline of 8.56%, with price retreating from an opening level of $1.5205 to $1.3905. Its weekly high reached $1.5310, while the low stood at $1.3189.
XRP falls below $1.43 as daily momentum turns negative
TradingView’s daily chart places XRP at $1.3903, below the 50-day moving average of $1.4336. The gap leaves the token roughly 3% beneath that average following its retreat from the late-September trading area around $1.50–$1.60.
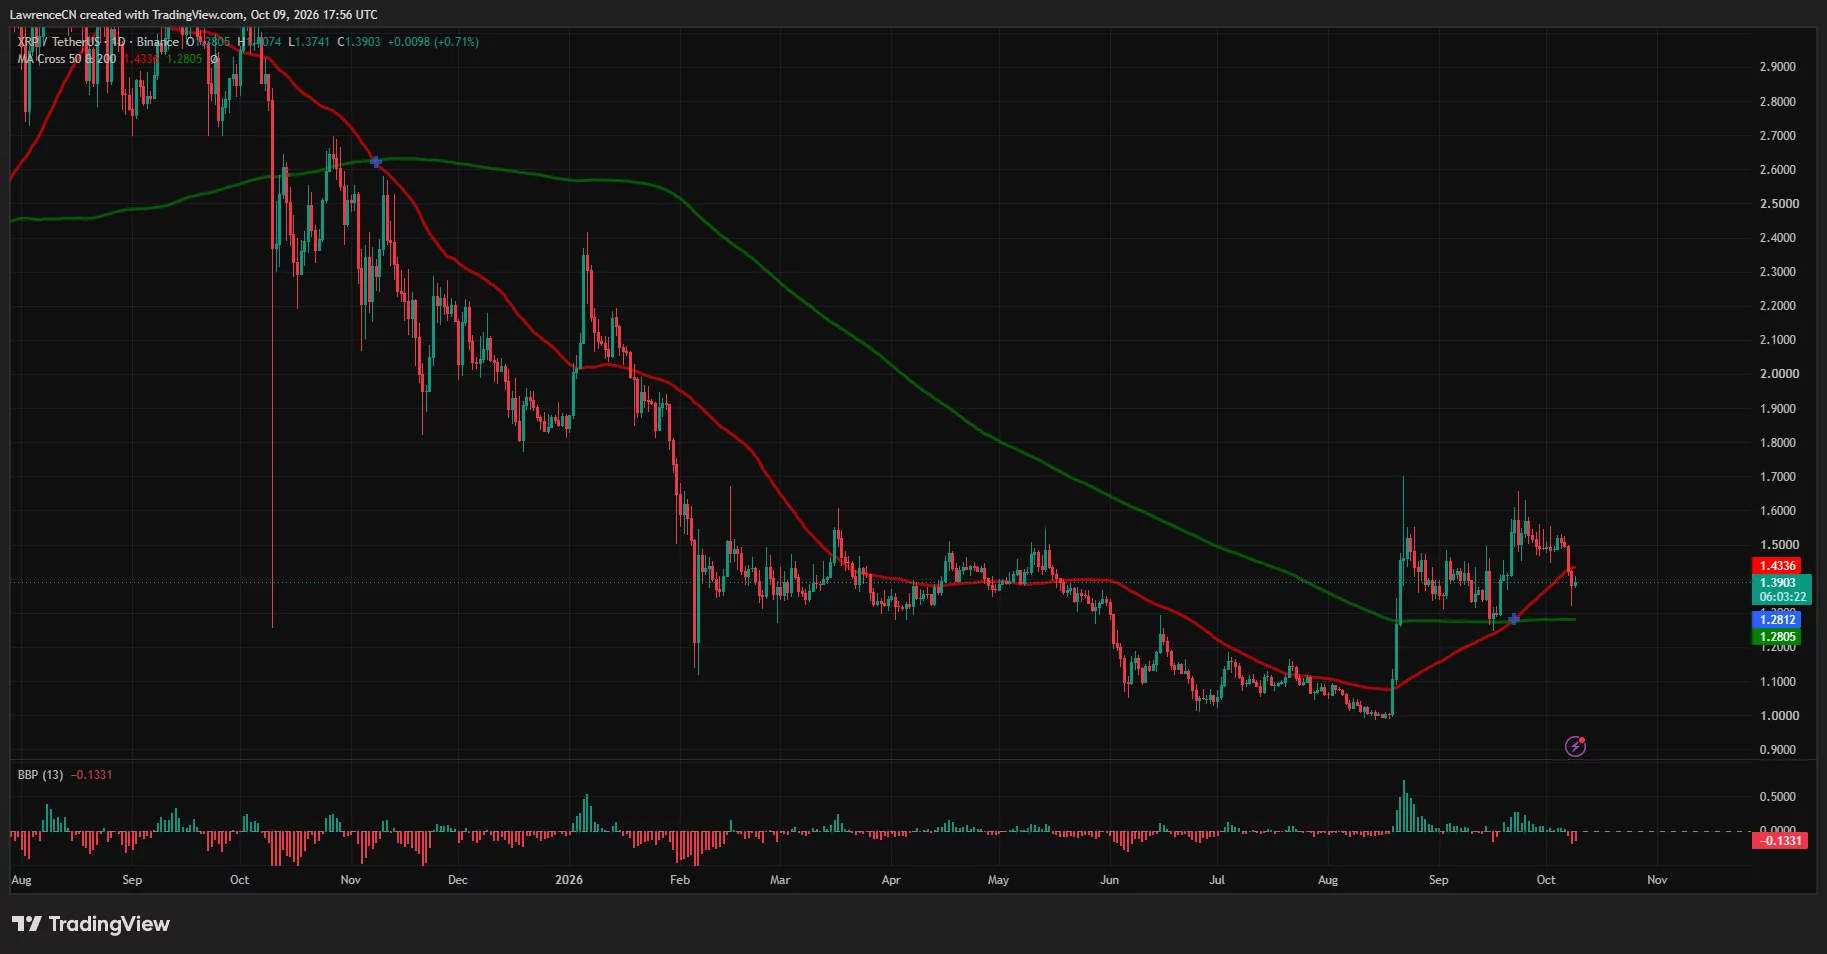
The daily chart shows the 50-day average rising above the 200-day average in late September. However, the latest sell-off has taken price back below the shorter average while leaving it above the longer one, which stands at $1.2805.
Based on those chart levels, a recovery first needs to regain approximately $1.43 before the recent $1.50–$1.53 trading area comes back into reach. Failure to recover that average would leave the bounce beneath the first major daily trend reference.
You might also like:
Bitcoin, Ethereum and XRP flash buy signals, will prices rebound?
The daily Bull Bear Power indicator also reads negative at minus 0.1331. Its recent red bars accompany the drop below the 50-day average, giving the rebound a weaker momentum backdrop than the August surge shown on the same chart.
On the downside, the weekly low near $1.32 is the closest clear price reference from the latest sell-off. A renewed break beneath that low would put the daily 200-day average around $1.28 in focus, approximately 8% below the current price.
Weekly resistance keeps $1.56 above the rebound
TradingView’s weekly Murrey Math indicator places a major support-and-resistance pivot at $1.5625. XRP remains below that level after its recent attempt to extend the recovery from the August lows.
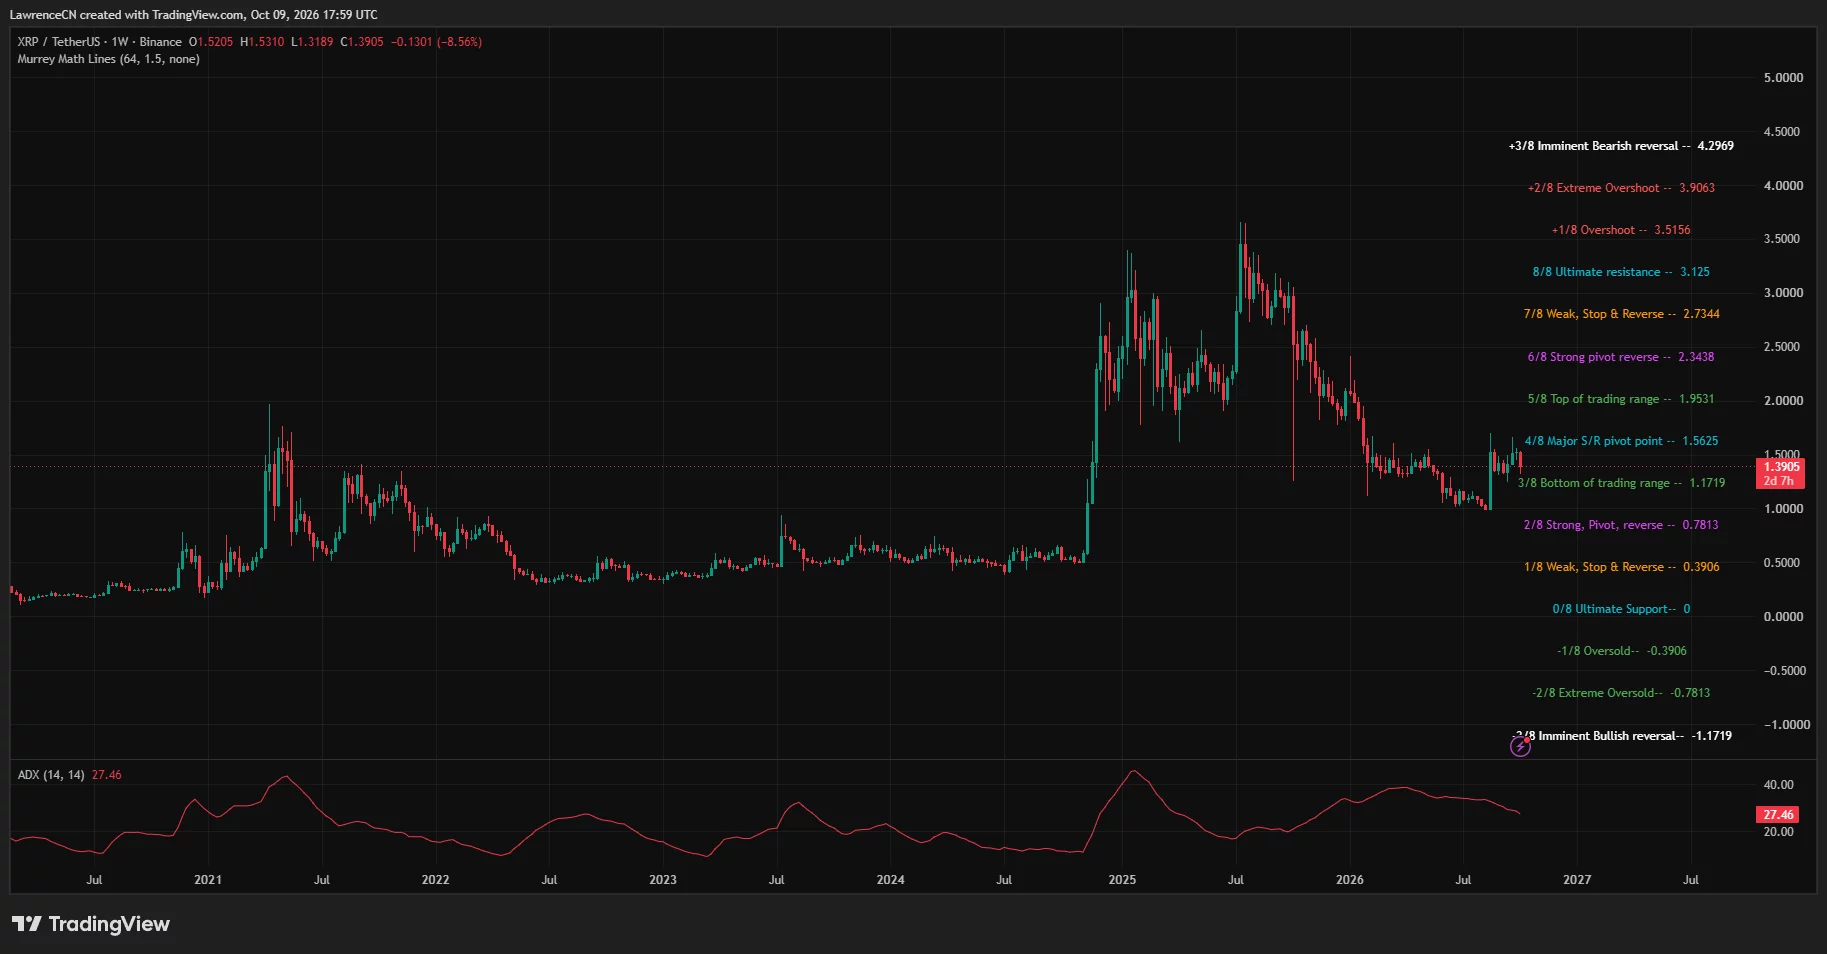
The same indicator marks the bottom of its trading range at $1.1719. That level sits below both the latest weekly low and the daily 200-day average, making it a more distant downside reference if the current recovery loses further ground.
The weekly Average Directional Index reads 27.46 and has declined from earlier readings above 30. The indicator measures trend strength rather than direction; the bearish direction comes from the falling price structure visible on the weekly chart.
A chart-based upside scenario would require XRP to recover $1.43, then clear the recent weekly high near $1.53 and the $1.5625 pivot. That sequence would bring the late-September highs around $1.60–$1.65 back into view.
Until those levels are reclaimed, the weekly chart shows XRP trading beneath the area where its latest recovery stalled. A move above $1.56 would weaken that bearish setup, while a break below $1.32 would strengthen the downside case.
Liquidation bands cluster above XRP’s current price
CoinGlass’s one-week liquidation heatmap shows XRP falling from above $1.50 to approximately $1.32 before recovering toward $1.39. The sharpest downward move appears late on Oct. 8, followed by a rebound that remained below $1.41.
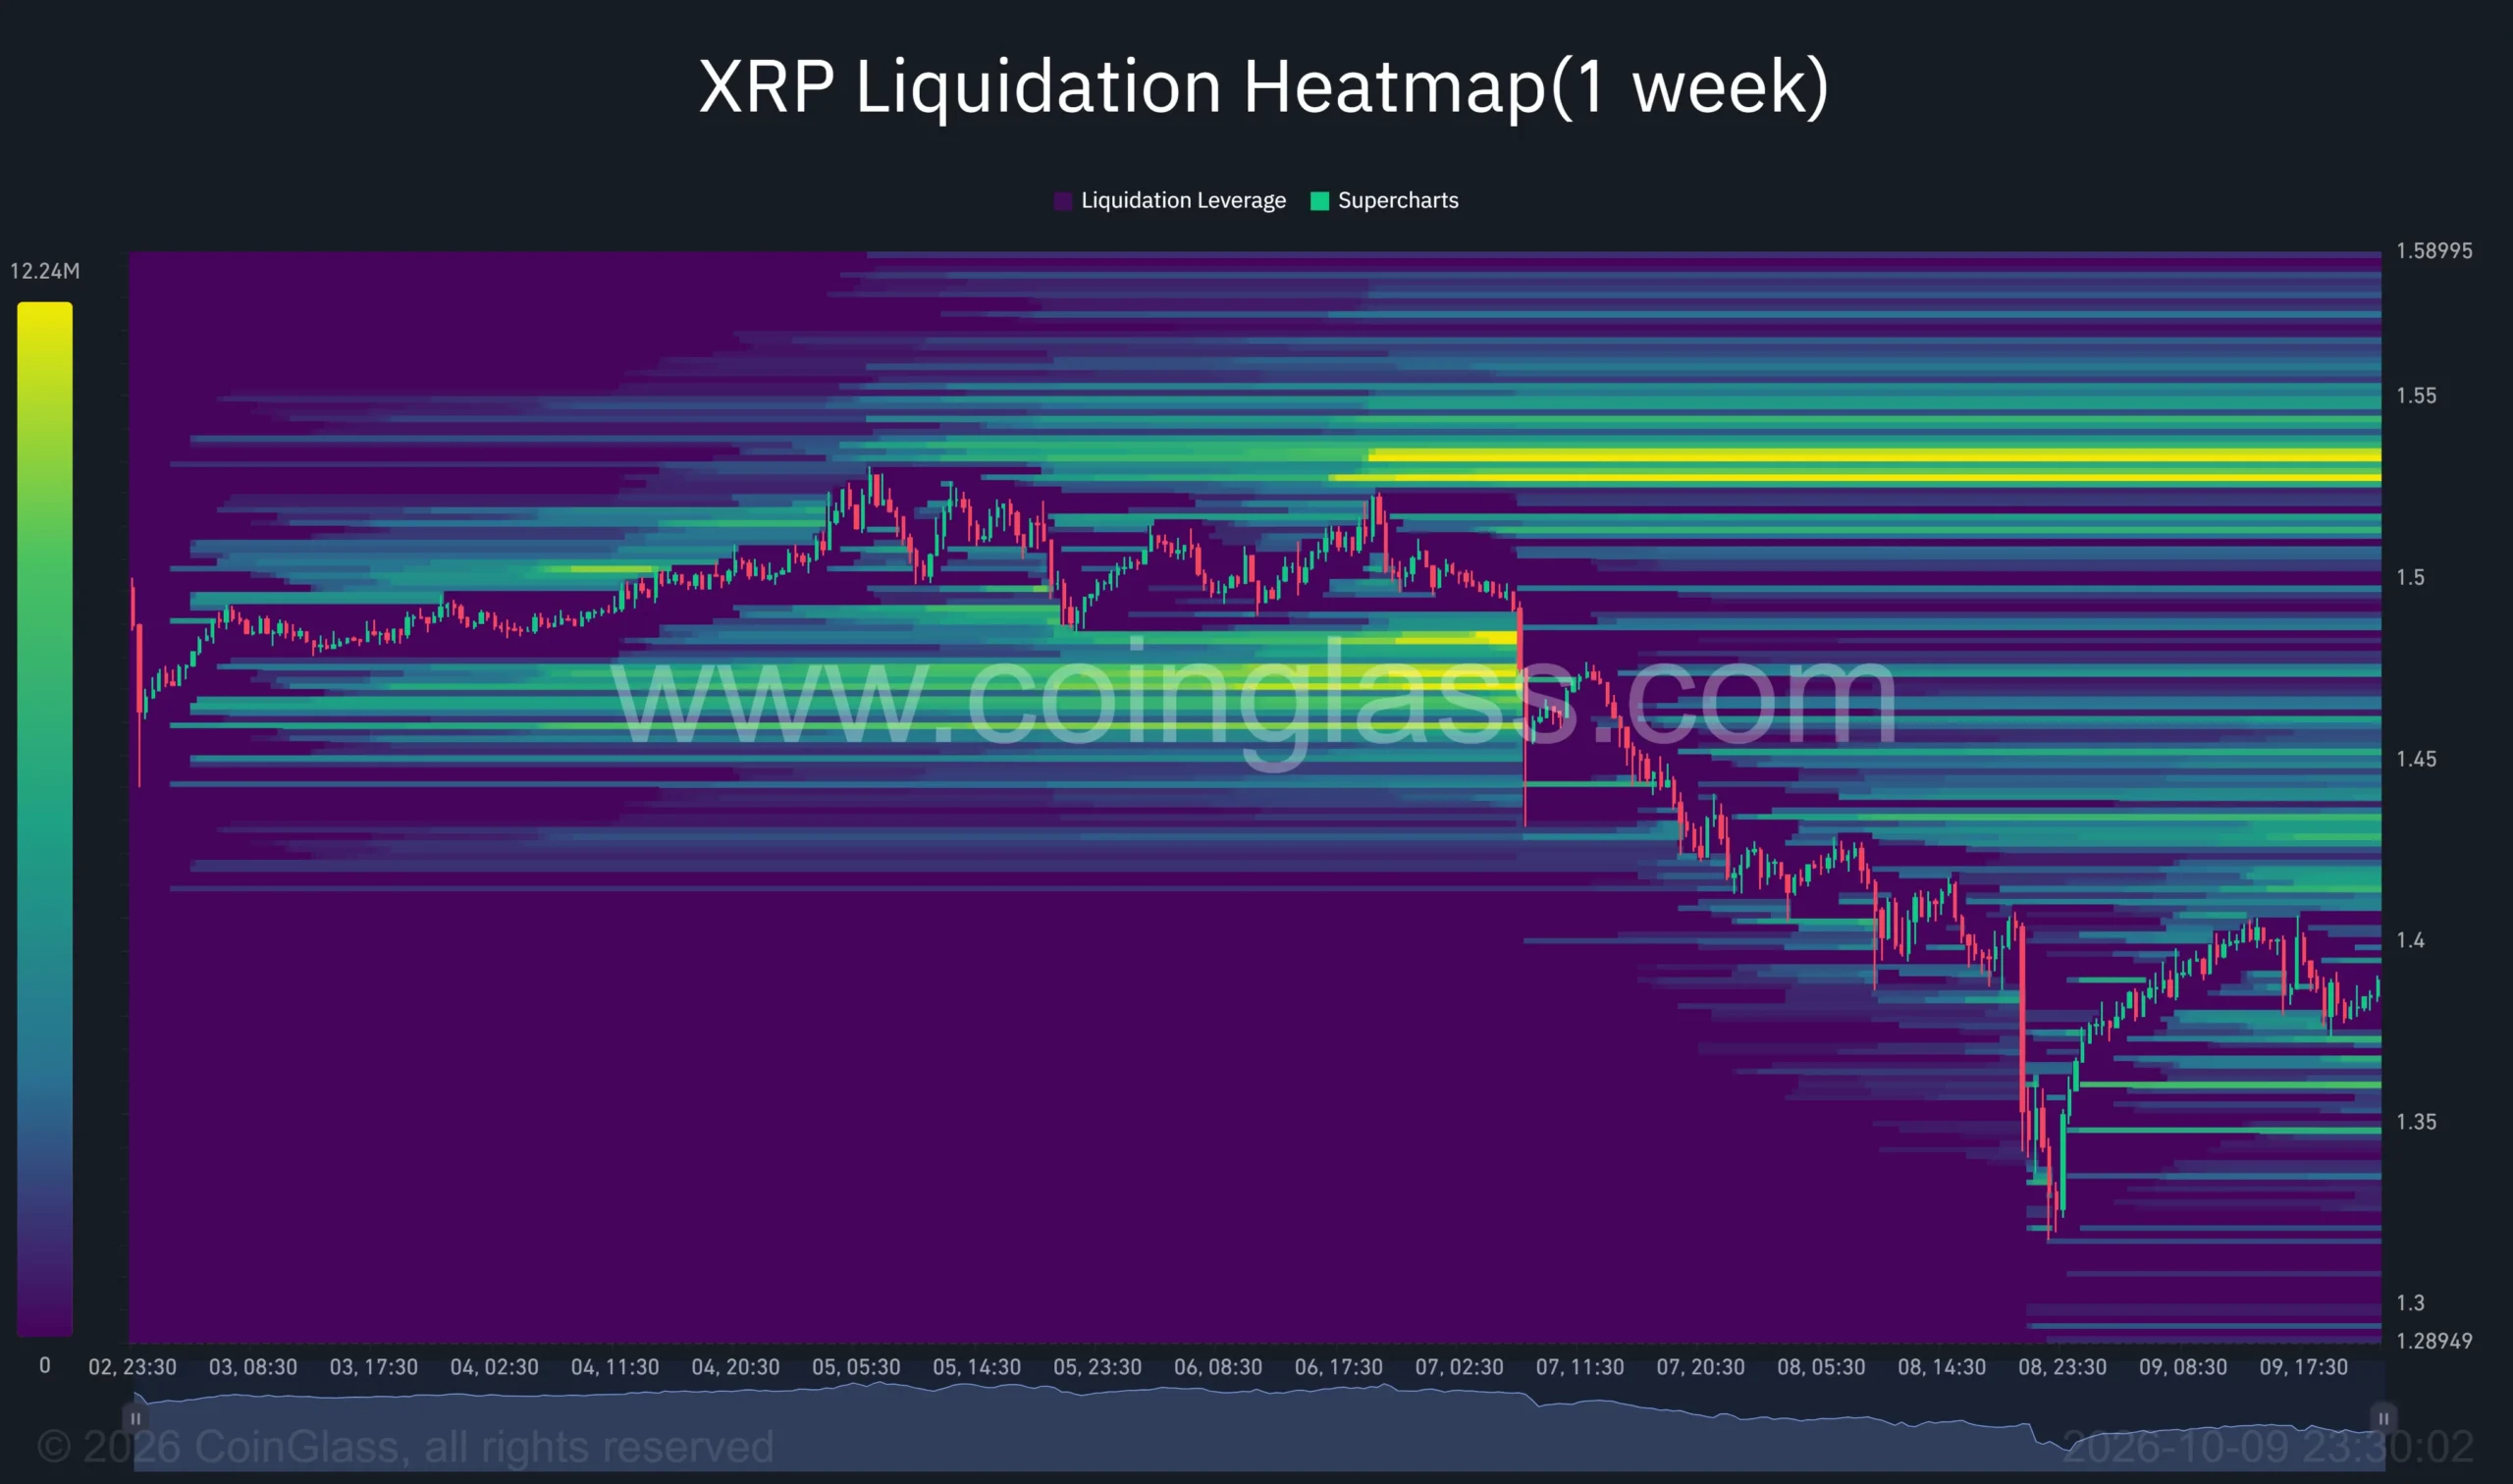
Near the right edge of the heatmap, overhead liquidation bands appear around $1.43–$1.44, with additional concentrations near $1.46–$1.48. The brightest persistent cluster sits higher, around $1.53–$1.54.
The lower portion shows concentrations near $1.36–$1.37 and around $1.35. Those bands place leveraged positions close to the rebound’s recent trading range, while the $1.53–$1.54 cluster overlaps the weekly high area.
Taken together, the daily chart and heatmap identify $1.43 as the first nearby recovery hurdle. The higher liquidation concentration becomes relevant to the bullish scenario only after XRP moves through the intervening price levels.
Oct. 12 listing remains a scheduled XRP catalyst
Evernorth attributed its postponed Nasdaq debut to an administrative delay, moving expected XRPN trading from Oct. 8 to Oct. 12. According to the company’s update, the business combination was expected to close Oct. 9, subject to customary conditions.
crypto.news reported that Evernorth expected to hold approximately 473 million XRP at closing. The proposed Nasdaq listing would give U.S. stock-market investors access to shares in an XRP-focused treasury company.
Separately, the XRP Ledger’s official release notice described version 3.4.1 as an emergency security update and scheduled the associated amendment for Oct. 9, conditional on continued validator support. The notice warned that outdated servers would lose synchronization after activation and said publication of the security-sensitive source code would follow later.
Ripple also announced on Oct. 6 that Ripple Prime would provide brokerage, clearing and financing services to Brevan Howard funds. The announcement put the investment manager’s assets at about $35 billion.
Against those developments, XRP’s immediate chart-based test remains the $1.43 average. Reclaiming it would improve the route toward $1.53–$1.56; losing $1.32 would instead expose the $1.28 longer-term average.
Disclosure: This article does not represent investment advice. The content and materials featured on this page are for educational purposes only.
Read more:
Coinbase stock target raised to $258 by Morgan Stanley
More Posts About This Newsroom
crypto.news
-
 Coinbase stock target raised to $258 by Morgan Stanley
-
 Bitcoin beats gold and stocks with 633% real return, study finds
-
Bitcoin price outlook: Where is BTC headed this October?
-
 Cardano price looks fragile below $0.24: Can it hold $0.21?
-
 Ethereum price at $2,500 crossroads as Supertrend turns bearish